Loading website...
Rotormaps© — 2020
100
%
Loading website...
Rotormaps© — 2020
100
%
Dedicated to mapping energy
to empower your decisions
Our Ethos
Our Ethos
INSPIRED BY TECHNOLOGY AND SUSTAINABILITY, WE STRIVE TO REVOLUTIONIZE ENERGY MANAGEMENT THROUGH ADVANCED MAPPING TECHNOLOGIES.
AT ROTORMAPS, WE CREATE DETAILED DIGITAL TWIN MODELS OF ENERGY ASSETS, ENHANCING DISCOVERY AND MAINTENANCE OF ELECTRICAL GRIDS AND SOLAR POWER PLANTS.
WITH A UNIQUE BLEND OF DATABASE INNOVATION AND AERIAL MAPPING, ROTORMAPS LEADS THE WAY IN ACCURATE MAPPING AND MONITORING OF ENERGY ASSETS.
COMMITTED TO CONTINUOUS DEVELOPMENT, WE PUSH THE BOUNDARIES OF ENERGY MANAGEMENT, technical innovation, and GEOSPATIAL TECHNOLOGY.
Technical Innovation
Aerial expertise
Smarter solutions
Cutting-Edge Technologies for a Seamless User Experience

Rotormaps has been analyzing the Japanese electrical grid and power generation challenges for over 12 years.
We have consulted for the research institute that supplies crucial information to electrical power companies.
By integrating databases, we developed a dedicated API, and created a map detailing power generation capacity and locations.
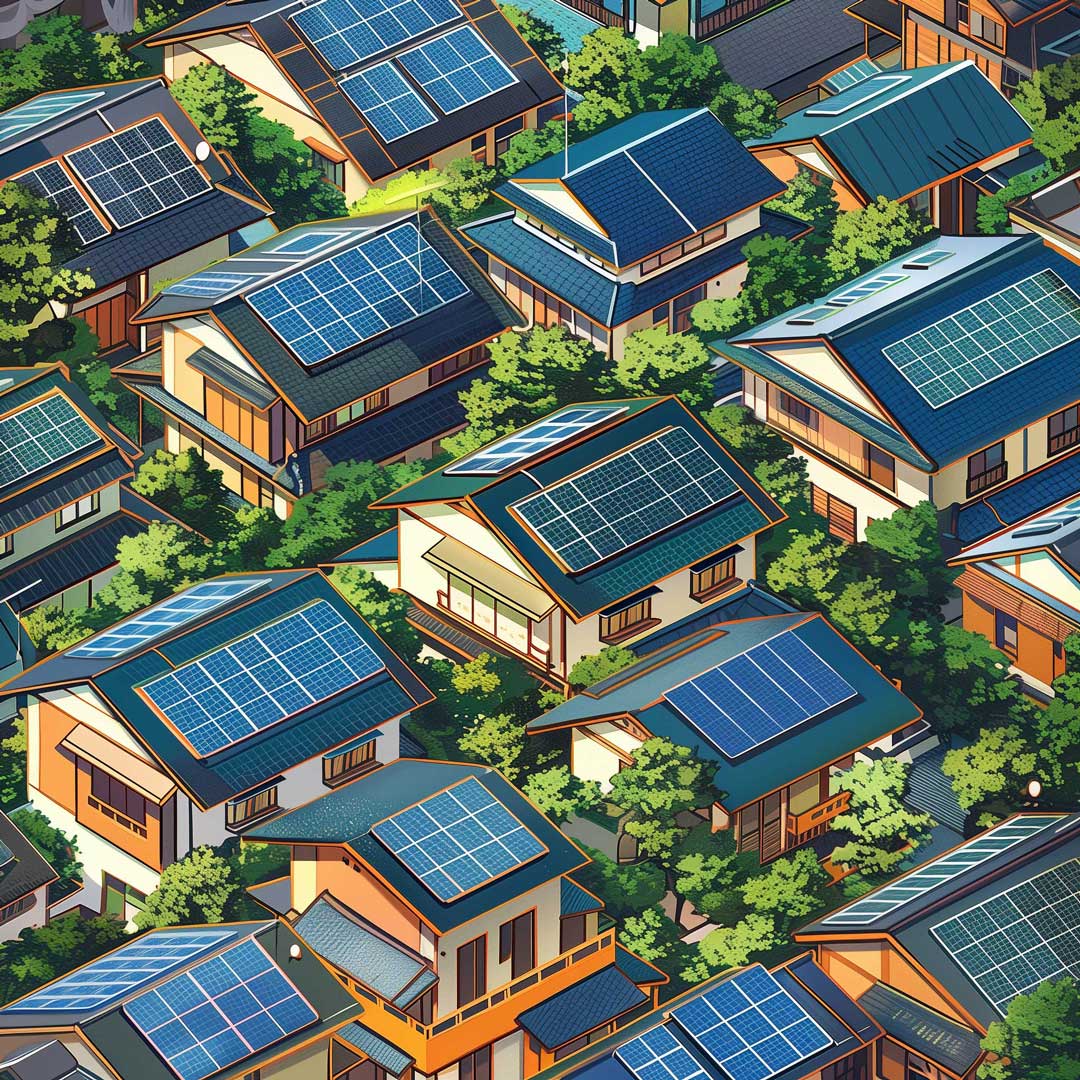
Using a machine learning-based approach, Rotormaps scanned all of Japan to identify solar panel installations.
Since solar panels need to face the sun to generate electricity, we employed the latest machine learning technology.
This technology is used to analyze satellite imagery and locate all solar panels, even those smaller than 10kWp DC.

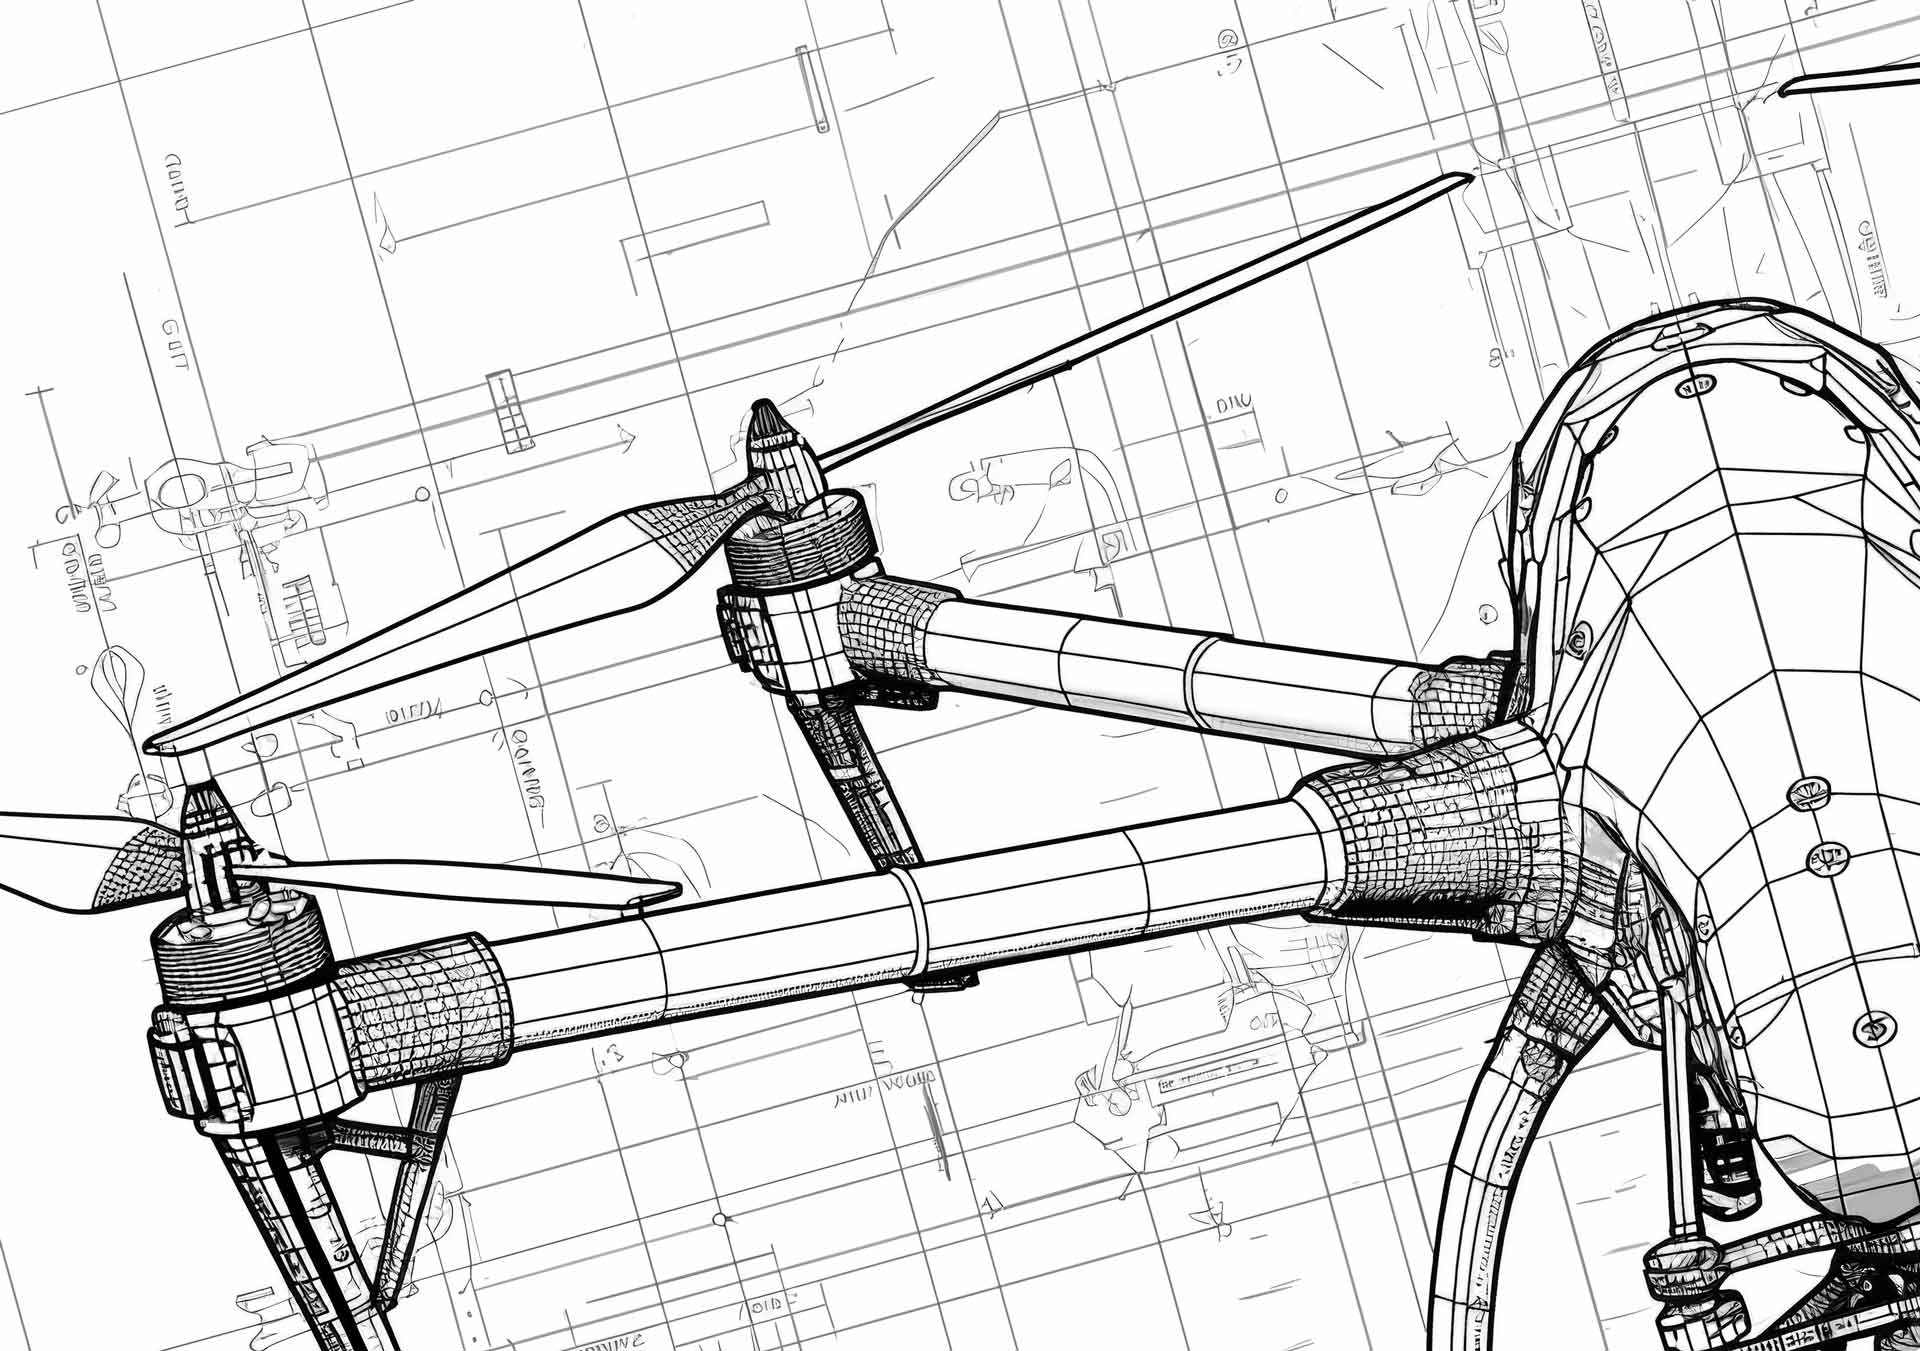
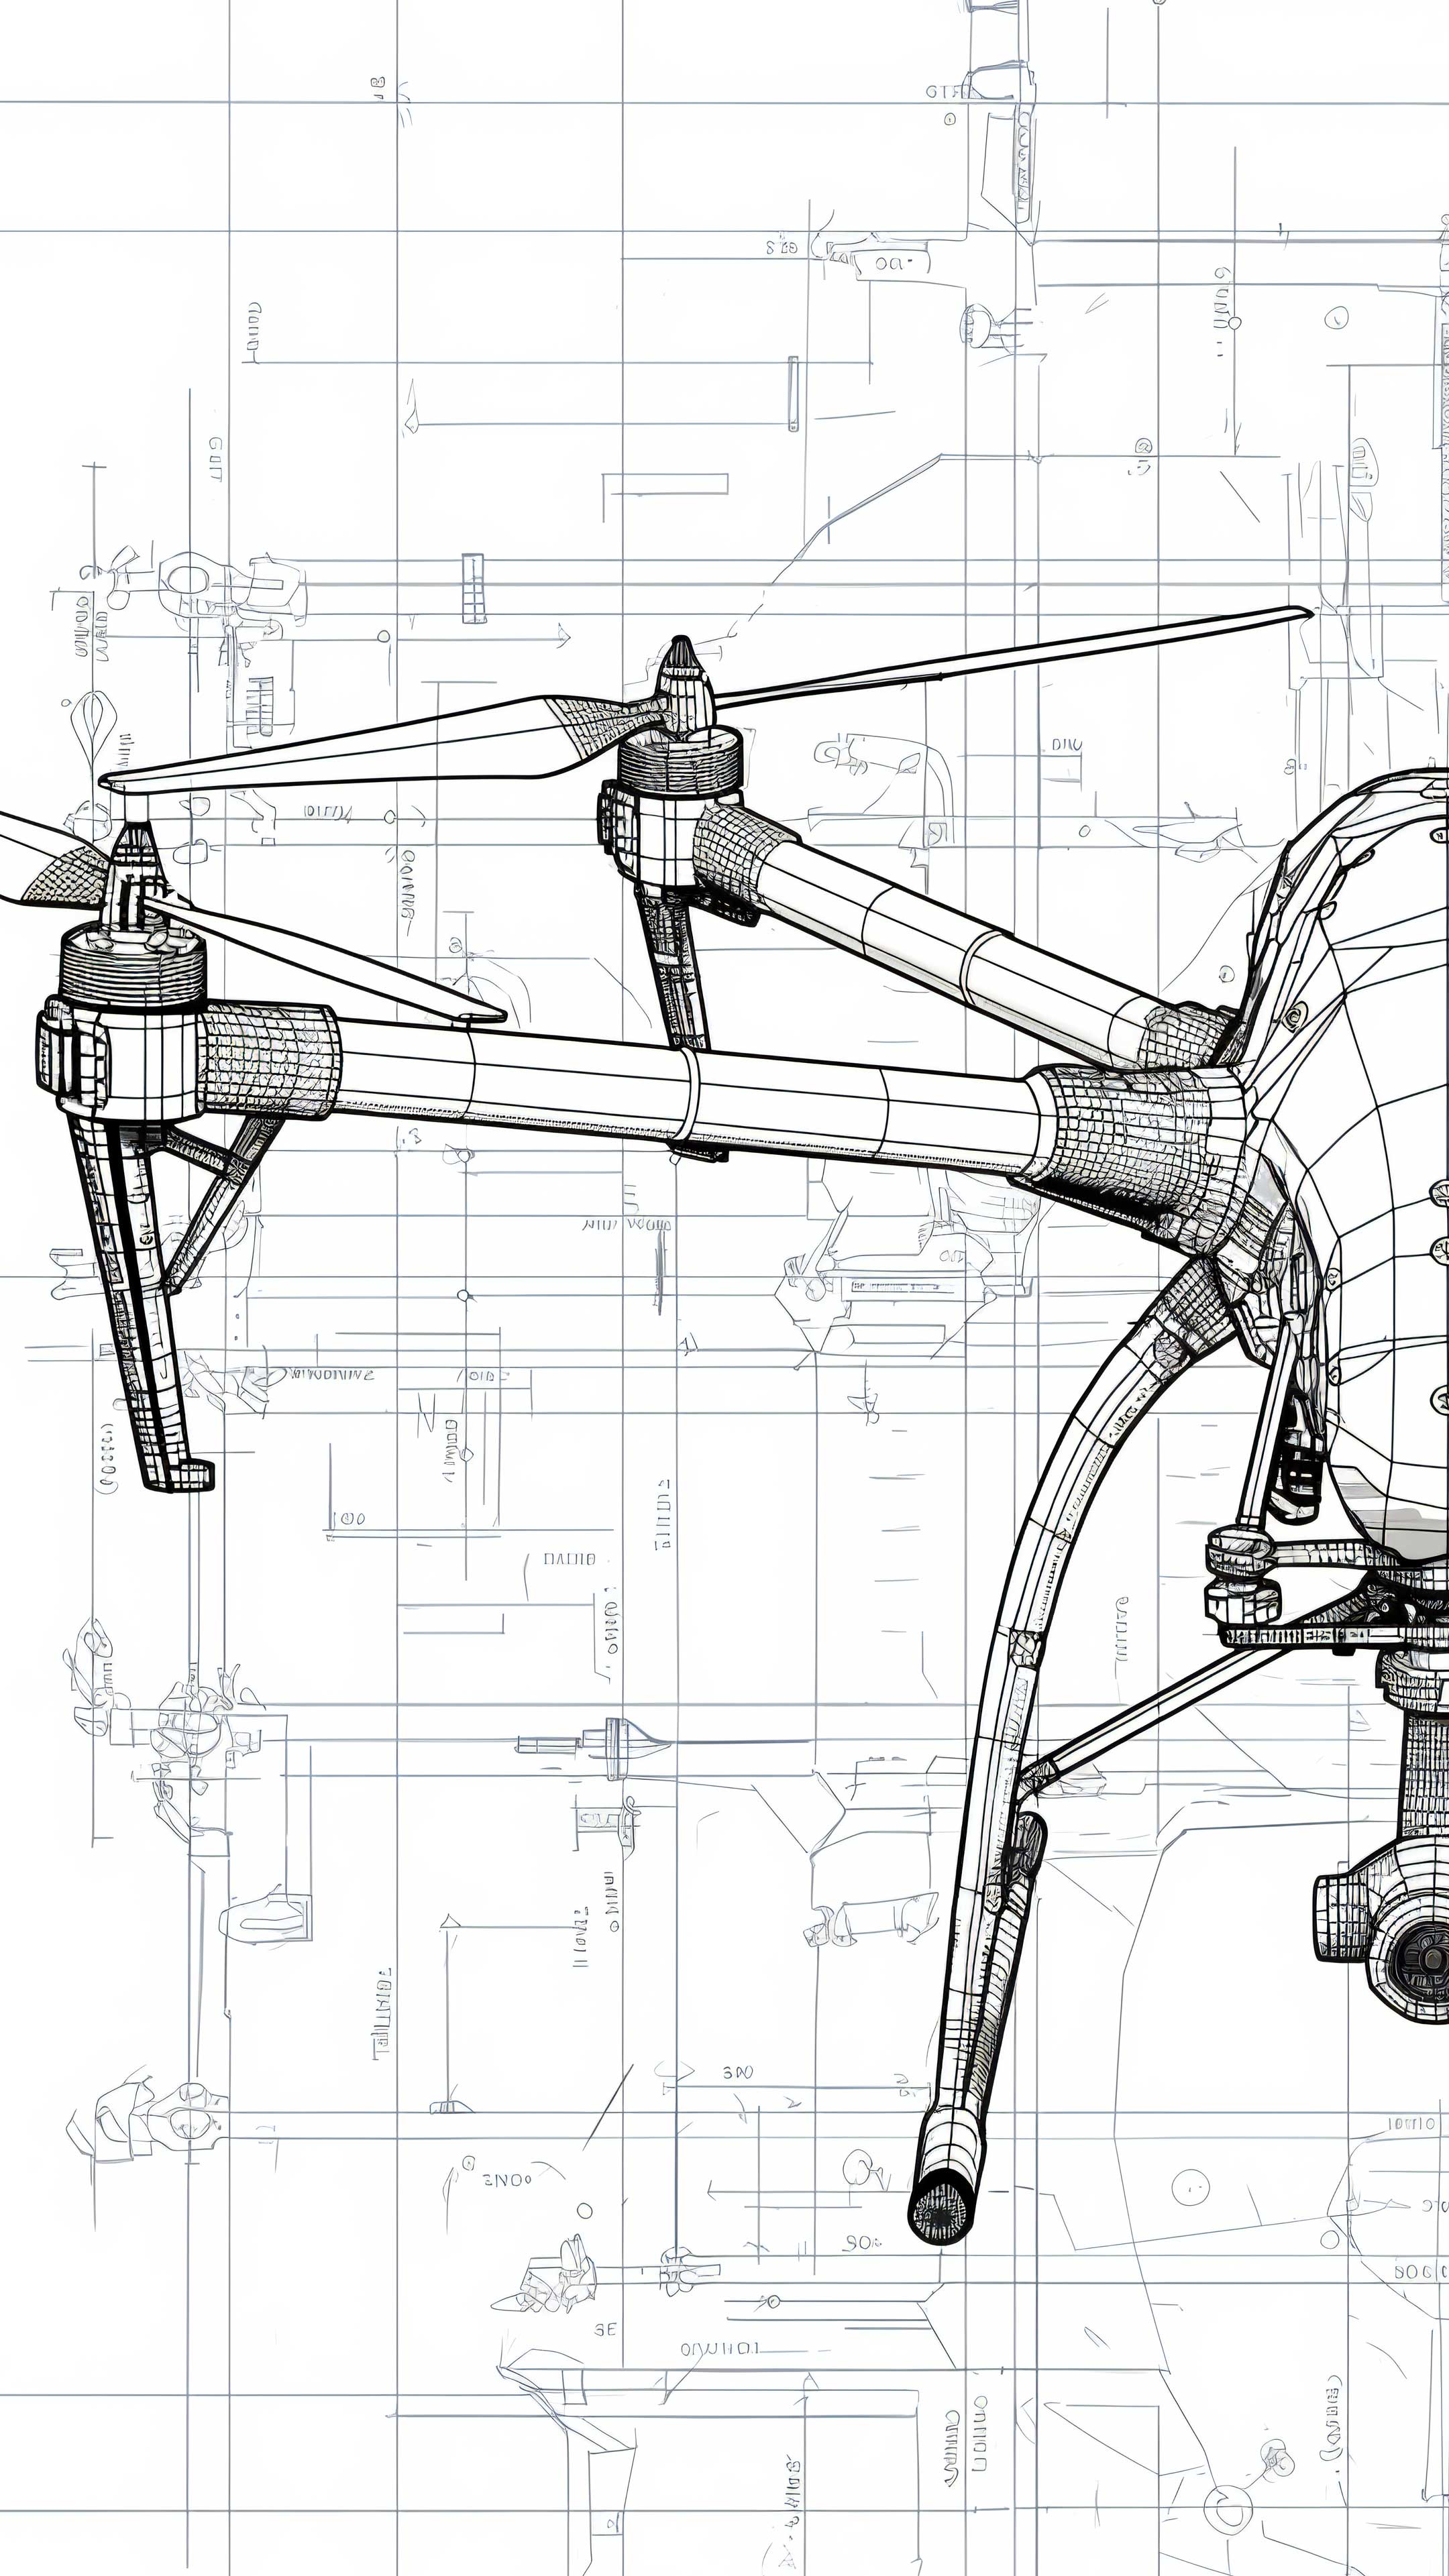
Using advanced dual-camera thermal drones, we enable third-party operators to easily detect defects in solar panels.
Users can import high-resolution infrared and photos, as well as pre-processed geo-orthomosaic images from various platforms, including power plant layouts.
Click here to learn more about our drone technology and start your free 15-day trial.
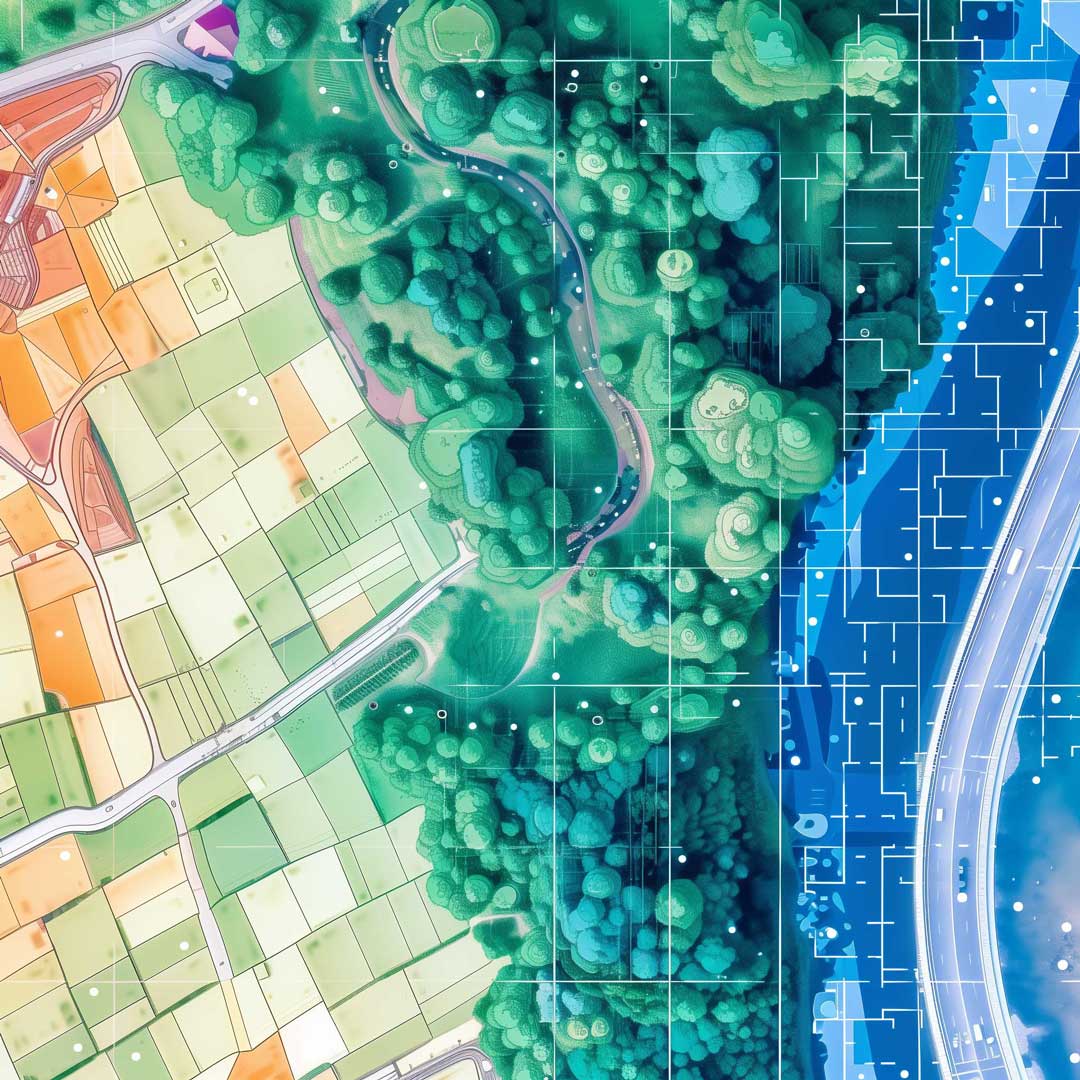
Utilizing the latest standards in orthomosaic imaging, we can coherently present photos directly on our platform.
You can layer your images with either thermal or visual photos in the foreground, add layouts you already have, and adjust the transparency of these layers.
This functionality allows you to quickly and accurately track defects in solar panels.
Sign up now to effortlessly navigate the complex Japanese electrical grid. Easily order different grid zones to enhance your map, and add your own maps for deeper analysis and study.
For solar asset owners, upload your drone photos to create detailed maps of your assets, complete with simple commenting and integrated energy loss calculations.
